How Evidence Shapes Great Customer Journey Maps
Every customer experience tells a story. Like all stories, it has a beginning, a middle and an end. It has main characters (customer, sales rep, UX/UI) and supporting roles (IT, finance, customer service). It can have moments of friction and seamlessness, points of pain and delight. And like all human experience, it is both emotional and rational.
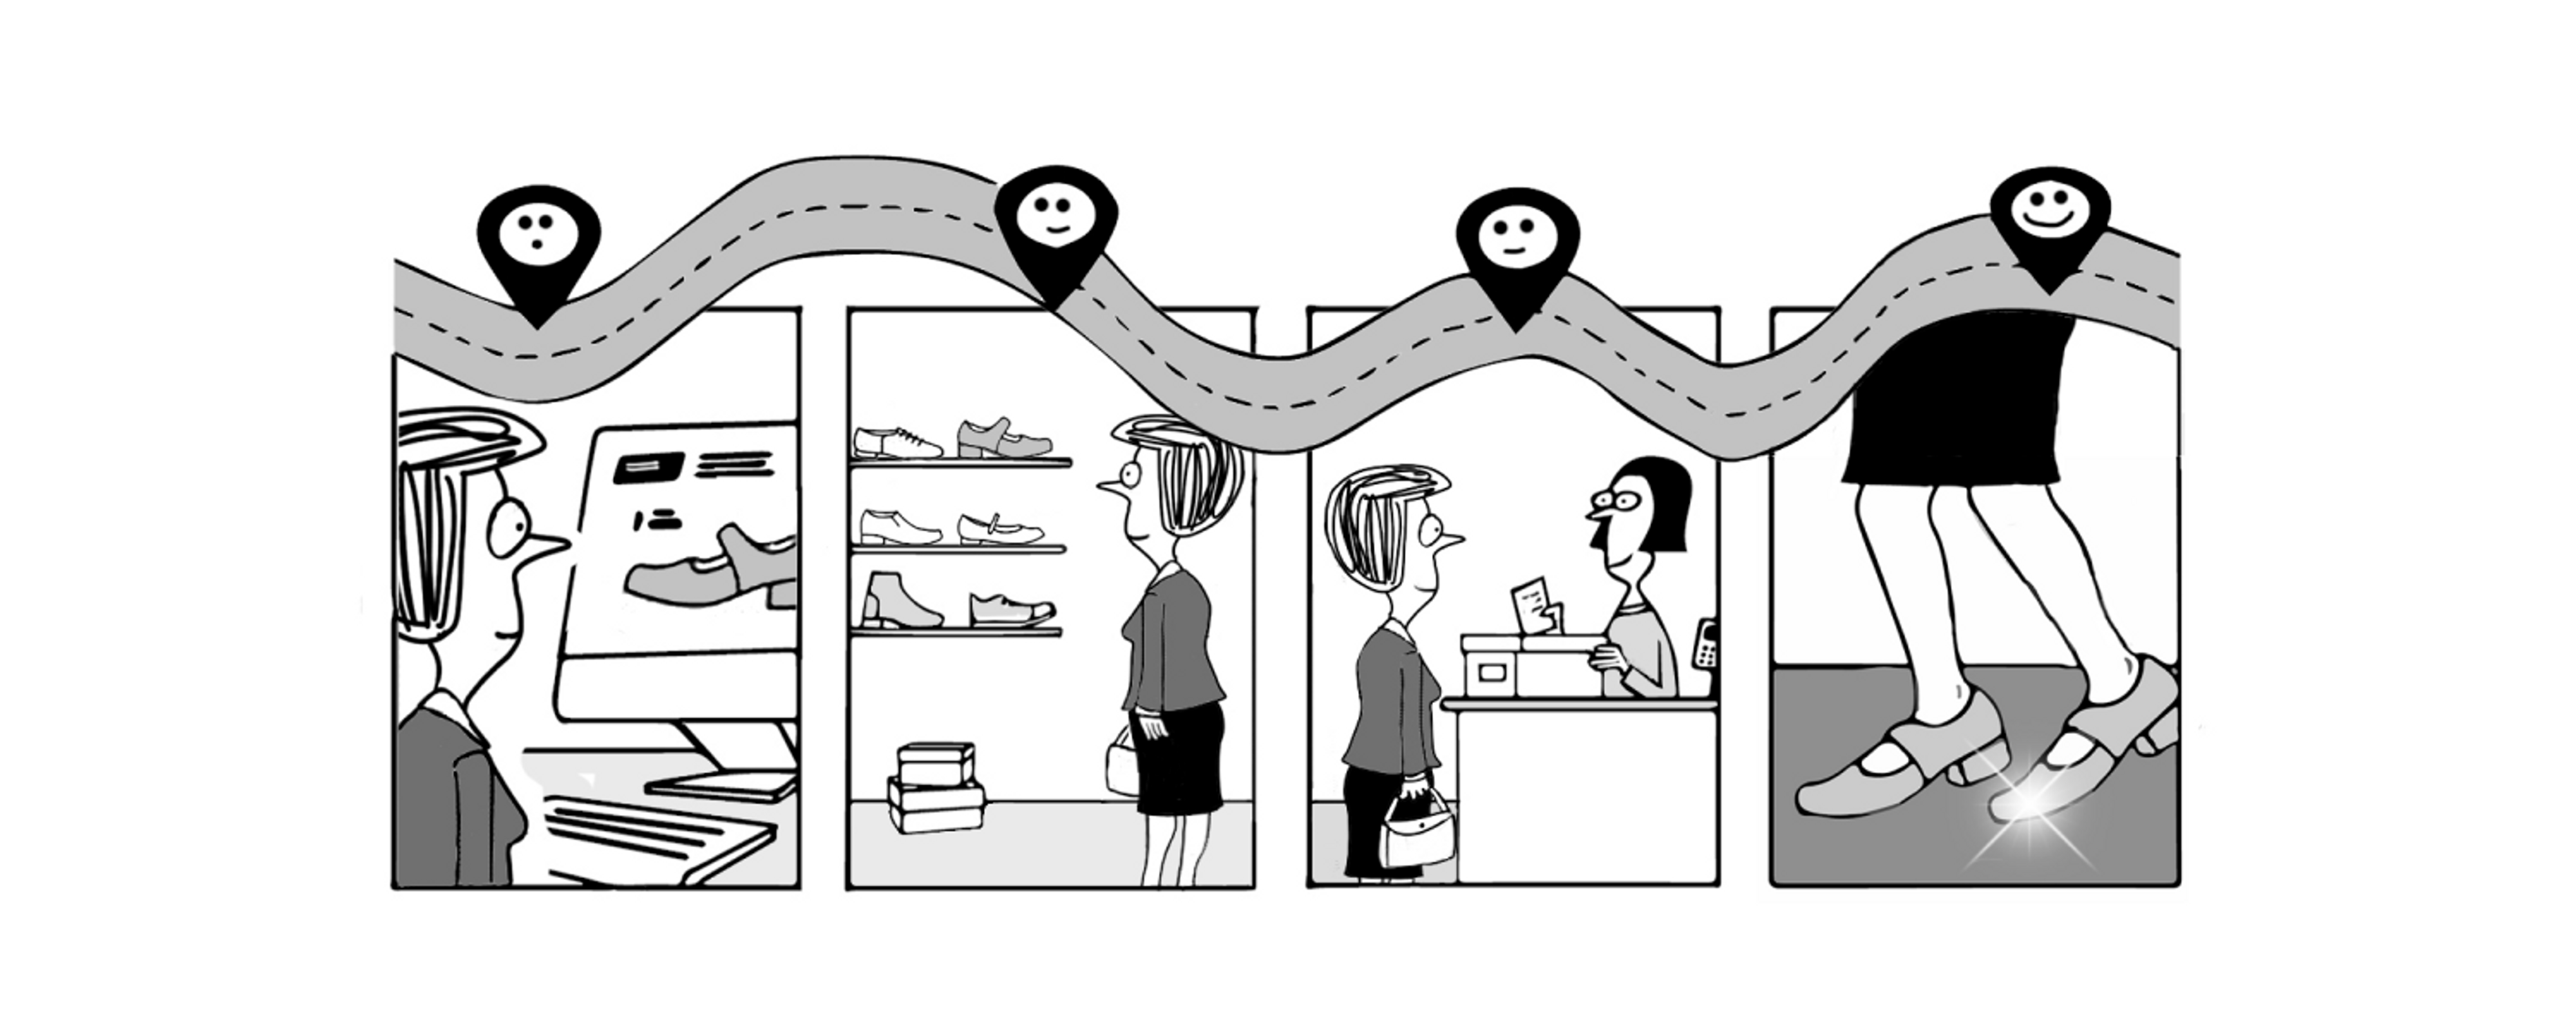
With so many moving parts, the best way to capture such experiences is to think of customer experience as a ‘journey’, and visualize it in the form of a map.
A multipurpose tool
Like a Swiss Army knife, a good journey map can be used for many different purposes, including opportunity mapping and prioritization, customer experience design, product and service development and marketing planning.
A journey map offers both a macro and a micro view of a customer’s experience over time. With a rich enough data set you should be able to zoom in and out of touchpoints along the narrative arc from beginning to end. You should be able to identify problem areas and opportunities for improvement. You should be able to visualize the intensity of a customer’s emotional response to a pain point and see it as an opportunity to create innovative solutions to the problem they are experiencing.
From a CX design perspective, you should be able to examine it within the context of the broader operational ecosystem to identify and understand which supporting processes and actors present opportunities for innovation. Ultimately the journey map itself becomes a tangible artifact, a living document that can be revisited and reshaped as new insights are uncovered and needs evolve.
But like all analytical tools, it’s only as good as the data upon which it is based. What often happens is that companies fail to gather and incorporate the kind of evidence needed to get the most out of the map’s potential for shining a light on where the gaps are. So below we’ve created a few suggestions on how to do that.
Observation: getting the right kind of evidence
We use journey maps to visualize the behaviours that occur when customers interact with products and services. One way to observe those behaviours is through ethnographic research. It’s not the only method, but it does allow us to get up close and personal with how people think and feel in response to specific experiential stimuli. It allows us to gauge the actions, risks and opportunities for innovative solutions and to help us decide where and when to focus our efforts. It is through these conversations that we uncover the evidence required to validate our decisions and make a strong case for change.
For instance, if you are looking at innovation in food preparation, your field work could consist of visiting people in their kitchens, watching what they make and how they make it. You could ask them questions as they work, or participate in the work yourself. You could eat with them and their families. You could listen to their stories about past and current cooking experiences. You could observe how they feel while they prepare the food and then share it. It’s important here not just to document what they do, but what they think and feel before, during and after they do it. This takes you beyond the tactical and gives you access to deeper, more tacit levels of knowledge. And it’s often at the tacit level that the real insights are revealed.
Co-creation: bringing the customer into the tent
Co-creation views customers as the experts of their own experience, giving you the evidence needed to identify and highlight their needs, questions, feelings and thoughts throughout their journey. This is where you turn the research data into a shared artefact that reflects and highlights key insights and learnings.
In order to gather the evidence required to create a useful customer journey map, we need to follow these steps:
Define the scope of the journey: Who are the users? Who are the customers? Where does the journey begin and where does it end? This knowledge allows you to have a high level overview and understanding of the journey’s different stages.
Validate the research: Talk to customers to further understand the context of their journey, their needs and wants, and feelings and actions. An empathy map is a simple tool for organizing what a customer feels, thinks, does and says about an experience they have had with a product or service. Design a facilitated workshop around the use of this powerful tool. And give the customer a seat at the table.
Sorting and prioritization: Undertake open/closed sorting and prioritizing of activities and events along the experiential path. This allows you to validate your understanding of the problem space and later, to design and run a facilitated workshop in which you sort and prioritize specific customer actions, pain points, and touch points across a journey.
Map the journey based on evidence: The goal is to identify any gaps you can fill to further refine your understanding of the customer and their needs. The evidence needed in order to create a great customer journey map includes:
- Touchpoints: validation of the stages and touchpoints of the specific journey.
- Customer actions: the specific actions taken by the user at each stage
- Pain Points: the friction points a customer experiences at each stage (if any)
- Backstage/System Actions: steps and activities that take place behind the scenes across the customer journey
- Opportunities: opportunities for change or innovation
The journey map itself becomes a tangible artifact and a piece of evidence that customers and other stakeholders can relate to. Working together and creating a great customer journey map allows you to generate trust, empathy and buy-in from potential users and stakeholders.
The utility and versatility of a good journey map make it an essential tool in any exercise that requires changes to, improvements on or re-imagining of a customer experience. Its micro and macro perspectives allow teams to dig deep into the details of an experience and then zoom out to see how they affect the big picture. With the right kind of data inputs, either from direct observation or co-creation with users and customers (or preferably both), you have the ingredients of a truly evidence-based visualization that can support product and service design innovations. You also have a living document which can serve as a touchstone for further refinement if needed.